Creating Custom Reports
Relevance to UDSv4
Custom reports in REDCap allow a REDCap user to select specific fields (rather than all fields in the project) to view and/or export. A user can limit the results included in the report to specific fields, records, or events using filtering tools.
Implementation for UDSv4
It can be helpful to analyze sub-sets of data. The example in this documentation will show how to create a custom report that only shows participants with delusions (data captured in Form B5) and then a further sub-set of those who live alone (captured in Form A1).
Best practices
Public reports
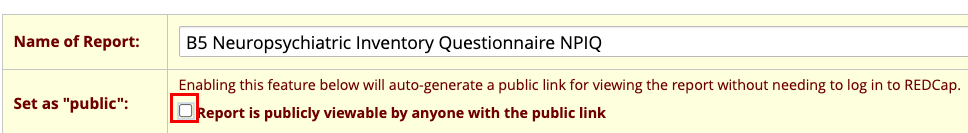
Some REDCap installations offer the ability to make a report 'public'. This means a project user can share the report url with others. It is highly recommended that this feature is not used for UDS data, due to the sensitivity of the data.
Instructional Video Guide
This video, provided by the REDCap Consortium, explains how Data Exports, Reports & Stats work in REDCap:
The video was made several years ago so some of the user interface may look different now, but the functionality remains. The demonstration of creating a custom report starts ~ the 2:30 mark.
Required Permissions
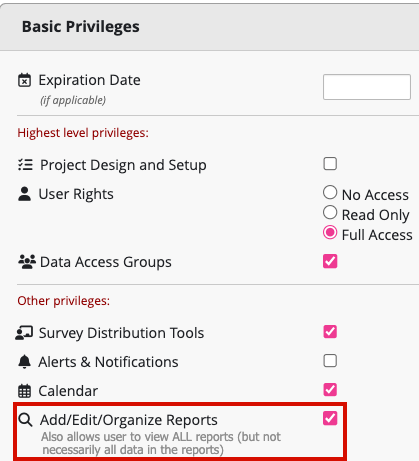
In order to create a custom report, a user must have 'Add/Edit/Organize Reports' privileges selected for them in the 'Other Privileges' section of Basic Privileges, found via the User Rights application.
Step-By-Step Guide for custom reports
-
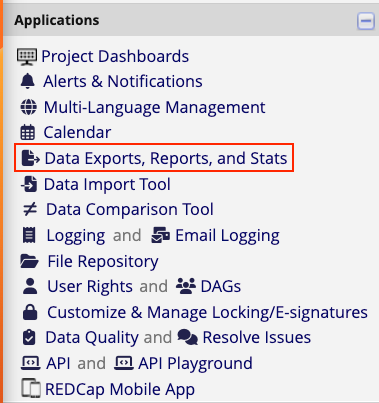
In the Applications section of the left-hand navigation bar, click on 'Data Exports, Reports & Stats'.
-
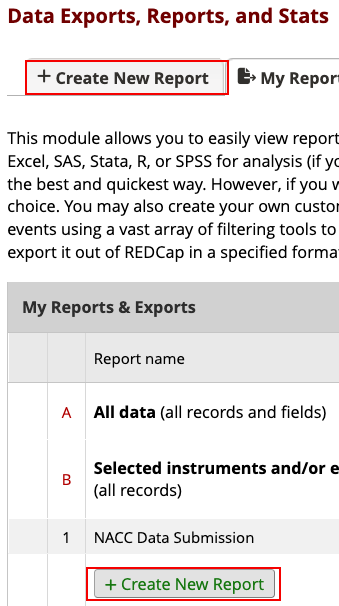
In your workspace on the right-hand side of the screen, you will see a tab 'Create New Report' and a 'create new report' button -- click on either one of those.
-
Enter a name for the report. You can optionally enter in a description or instructions in the description section.
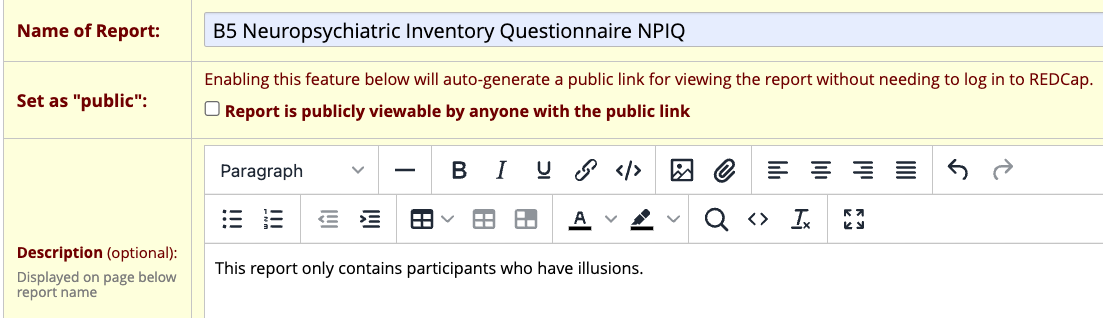
As noted in the Best Practices section, it is advisable to NOT make the report public.
-
Under Step 1, if you wish, you can select who in the project has viewing and editing permissions:
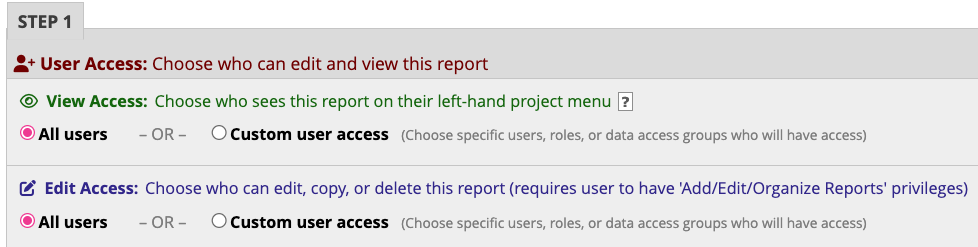
This feature will only be available to users on the project who have "Add/Edit/Organize Reports' privileges. Multiple users might want to use a report in different ways and might choose to change some of the fields, filters or sorting options. This setting will allow you to restrict other users' ability to make those changes.
-
Specify the fields to include in the report. You can do this several ways:

a. Click on the 'Quick Add' button to easily tick the fields you want to see in the report.
b. Use the 'Select Instrument' option to bring in all the fields for one instrument.
c. Click on the Field drop-down to select a field, one at a time, from a drop-down list of fields.
NOTEIf your list of fields is very long, it can be easier to find them by clicking within the box and typing the variable name or field label. An autocomplete dropdown is available to easily select the field.

-
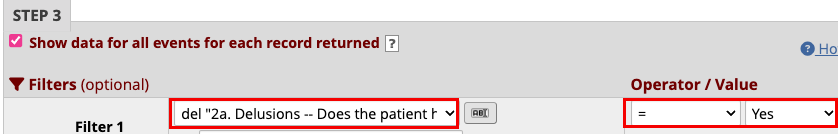
Specify a filter for the records (optional)
You can apply filters by selecting the relevant fields and specifying an operator (e.g., "equals") and a value to match. For complex expressions involving functions or requiring parentheses, click 'Use advanced logic' to write your filter expression.
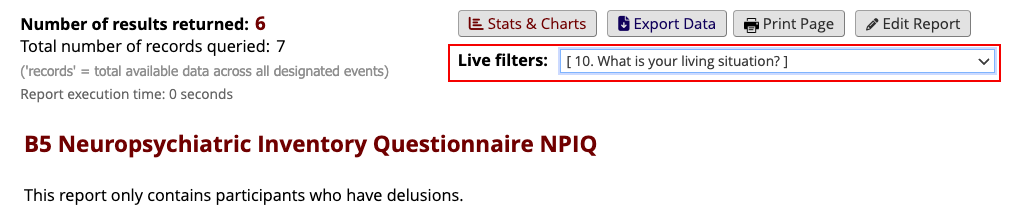
By applying logic, you are limiting the results returned in the report. For instance, if you only want to see the results for participants who have delusions, you could use question 2a Delusions and set it to 'yes'. That would omit any records that didn't have that question marked 'yes'.
Here is how the report would render:
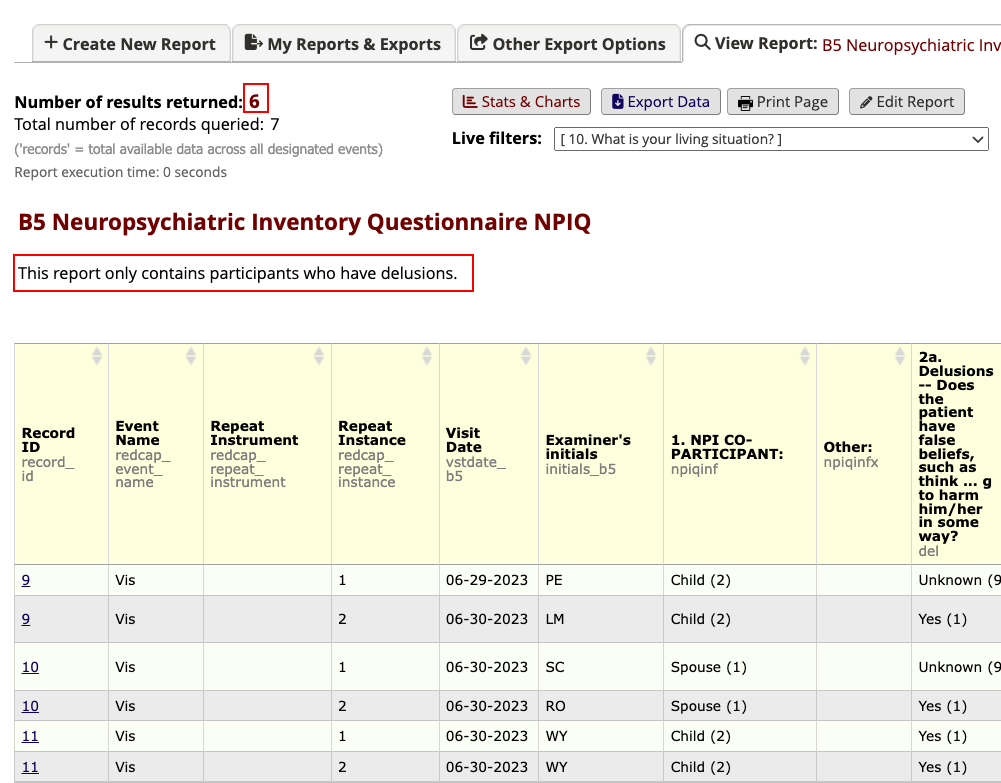
Note that the number of results returned is '6'. That's because out of the 7 visits across all participants in the project, 6 of them indicate the participant is having delusions.
-
Live filters dynamically filter data as it appears on the screen in real time. Only choice fields (yes/no, true/false, multiple choice radio button or drop-down) and the record ID field can be used as Live Filters. To apply a live filter, you can select it from the list of choices. You can add up to 3 live filters per report.
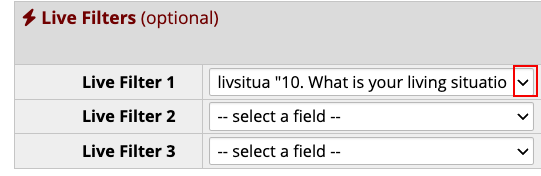
In this example, we're applying a live filter for the participant's living situation. When you first view the report (with no live filters), you would see participants who have delusions. If you wanted to know how many participants who have delusions live alone, you could click on the live filter and select 'live alone'.
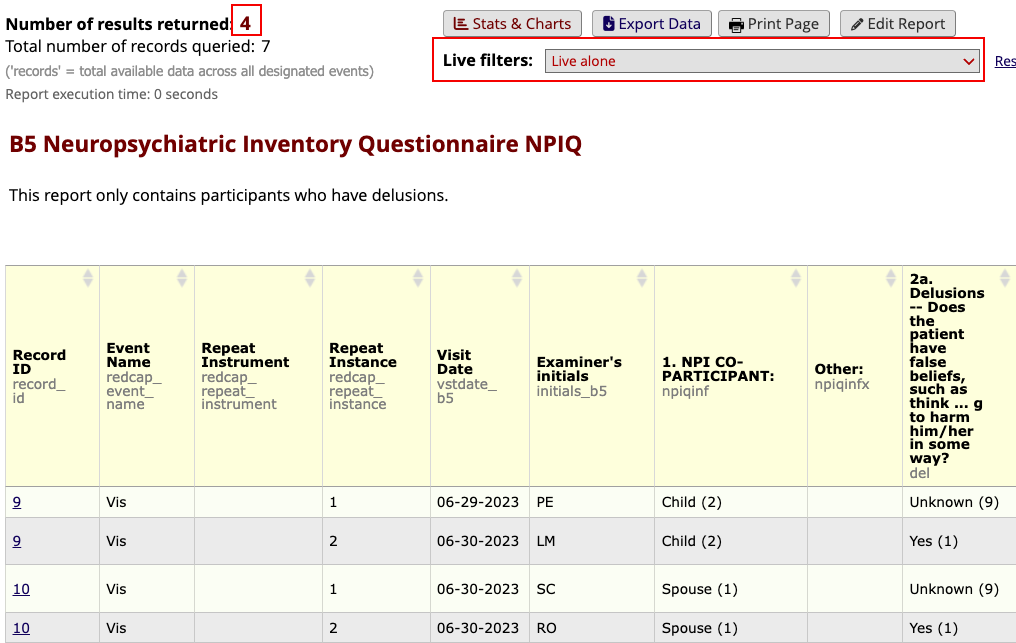
You would then be looking at a sub-set of your data: participants with delusions who live alone.
Note that the field
livsituais not in form B5. You can use any field in the project, regardless of where it is located, as a live filter in a report. -
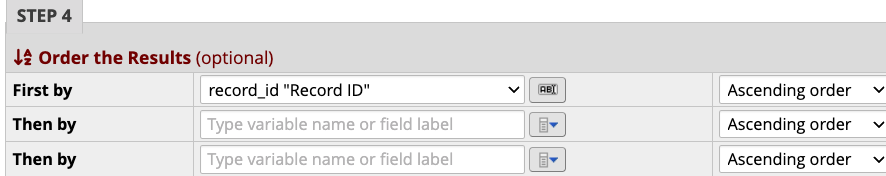
Specify up to three of the report fields by which the records will be sorted. By default, the report will sort by record ID, but you can sort by any other field in the project. If you were looking at the results for one participant, it might make sense to sort by the visit date.
-
Click Save Report. You will be asked if you wish to View the Report, Return to My Reports & Exports or Continue Editing report.
Once created, the report is bookmarked on the left-hand navigation bar in the Reports section:
With the report bookmarked, you can be working in any place in the REDCap project and be able to quickly click on the link to bring up the report.
Additional Resources/Tips
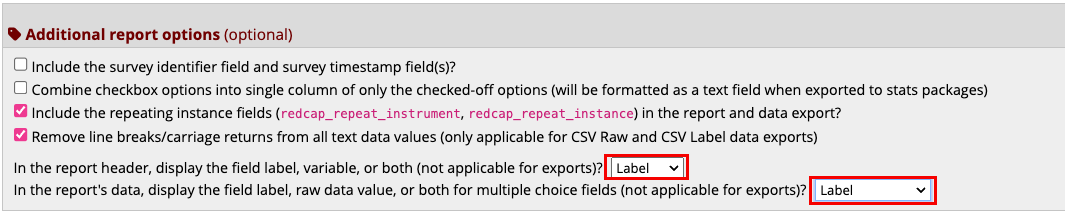
Labels vs variables in reports
For viewing the data within REDCap, the tables can look a little 'cleaner' by selecting the option to only view the label for both the header and choices fields. That option can be found in step 2 of building the report:
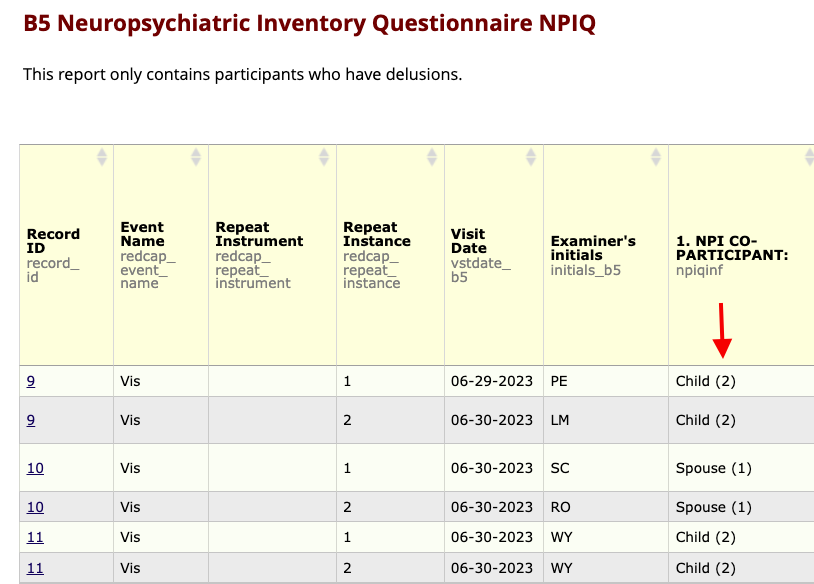
With the default setting, a report would look like this -- note the choice number in parentheses in the NPI Co-participant column:
With the label display option applied, the report now looks like this:
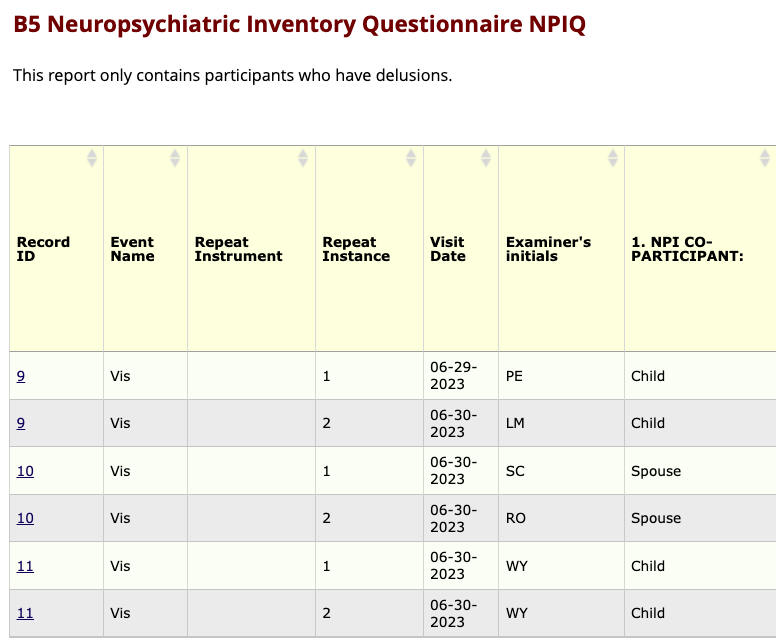
Note that the raw variable name does not display in the header row and the choice values do not appear in the table.
If a Center is planning to create a custom report for CSV upload to NACC Data Platform (via ADRC portal or API), the CSV headers should exactly match the published non-REDCap DED for the module (i.e., any REDCap specific columns should be removed from the CSV before upload). Examples of REDCap-specific columns are redcap_repeat_instrument, redcap_repeat_instance, redcap_event_name and form status variables (e.g., form_header_complete).